
Data Wrangler in Fabric Notebook-More than the Power Query In Python
- gowheya
- Oct 14, 2025
- 3 min read
📌 Overview
Data Wrangler in Microsoft Fabric provides an interactive, no-code interface for cleaning, transforming, and exploring your data directly inside a Fabric Notebook.It bridges the gap between visual data prep and reproducible code — letting you explore data interactively and automatically generate Python (Pandas or PySpark) scripts for production.
💡 Why Use Data Wrangler?
Capability | Description |
🧩 Visual Interface | Clean spreadsheet-like grid for exploring and transforming data |
🧠 Smart Profiling | Auto-detects data types, unique counts, nulls, and distributions |
⚙️ Code Generation | Exports equivalent Python/PySpark code for reproducibility |
🔗 Native Fabric Integration | Works directly with OneLake, Lakehouses, and DataFrames |
🚀 Accelerated Prep | Perfect for early-stage data cleaning, profiling, and transformation |

🧩 When to Use Data Wrangler
✅ Best for:
Rapid data exploration and cleaning
Preparing datasets before modeling or visualization
Low-code environments and collaborative data analysis
🚫 Avoid for:
Large-scale ETL or multi-table joins
Automated, scheduled data pipelines
Transformations requiring advanced Spark operations
🧪 Step-by-Step Tutorial
Step 1: Load Your Dataset
Start by loading a table or file into a Spark DataFrame.

Step 2: Launch Data Wrangler
From the DataFrame output cell:
Click the “⋮ (More options)” icon.
Select “Data Wrangler”.

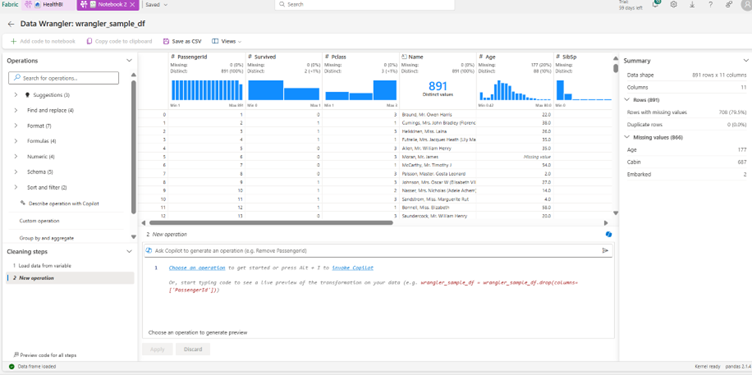
Step 3: Explore and Profile Your Data
Once open:
View data summaries (nulls, types, unique counts).
Sort or filter directly.
Identify anomalies or missing values visually.
Step 4: Apply Transformations
Perform transformations directly from the UI:
🧹 Remove duplicates
🔄 Change column data types
✂️ Split or merge columns
🧮 Create calculated fields
🧍 Filter out invalid rows
Each transformation is automatically tracked in the “Applied Steps” pane.

Step 5: Export Generated Code
Once you’re satisfied:
Click “Add code to Notebook”
Review the auto-generated Python/PySpark code.
Example output:
# Code generated by Data Wrangler for pandas DataFrame
def clean_data(wrangler_sample_df):
# Sort by column: 'Ticket' (ascending)
wrangler_sample_df = wrangler_sample_df.sort_values(['Ticket'])
# Drop duplicate rows across all columns
wrangler_sample_df = wrangler_sample_df.drop_duplicates()
return wrangler_sample_df
wrangler_sample_df_clean = clean_data(wrangler_sample_df.copy())
wrangler_sample_df_clean.head()

Step 6: Save or Continue Your Workflow
Save your transformed dataset back to your Lakehouse
You can now use this data for:
Power BI Semantic Models
Dataflows
Further Fabric Notebooks or Pipelines
⚙️ Best Practices
✅ Use sampled datasets for quicker performance✅ Review and optimize generated code before production✅ Use Wrangler for interactive prep, and Dataflows or Pipelines for automation
⚠️ Known Limitations
Limitation | Workaround |
⚡ May slow down on very large datasets | Use data sampling or filter before launching |
🔗 Single-table operations only | Use PySpark or Dataflows for joins |
⏱ No scheduling or automation | Integrate with Fabric Pipelines or Notebook jobs |
⚡ Final Thoughts
Data Wrangler bridges the gap between visual data preparation and code-based transformation.It empowers analysts and data enthusiasts to:
Clean and prepare data efficiently
Learn PySpark/Python naturally
Transition smoothly into advanced notebook-based workflows
If you’ve ever wanted to learn PySpark but didn’t know where to begin — start with Data Wrangler.You’ll be writing transformations confidently before you realize it.

Related contents:
Live demo on Data Wrangler in Fabric : https://www.youtube.com/watch?v=Ge0VWZMa50I
Microsoft Learn : https://learn.microsoft.com/en-us/fabric/data-science/data-wrangler


Comments